Two surfaces, one vocabulary — so one dashboard.
VS Code Copilot Chat and the Copilot CLI both emit the OpenTelemetry GenAI conventions. The attributes are identical; the surfaces differ in service.name. Turn that into a dropdown and two data streams become one board.
resource.service.name = copilot-chat
Enable with four github.copilot.chat.otel.* user settings, or the same env vars.
resource.service.name = github-copilot
Enable with OTEL_* env vars. Same telemetry engine, shared with the Copilot SDK.
Which Copilot surfaces emit OpenTelemetry?
Not all of them — yet. This project is built and verified on the two you can collect from today — VS Code and the CLI (the desktop Copilot app rides on the CLI runtime) — plus the SDK for apps you build. JetBrains joined the list in July 2026. No overclaiming.
Traces, metrics, and events — the questions they answer.
Every interaction is a span tree: invoke_agent → chat → execute_tool. All of it follows the GenAI conventions, so the same queries work on both surfaces.
Prompt‑cache efficiency
Hit vs miss over time, per model, per surface.
gen_ai.usage.cache_creation
Tokens & cost
Input/output/cached tokens, plus per-call cost and AI credits.
github.copilot.aiu
legacy: nano_aiu ÷ 1e9
Speed
Duration and time‑to‑first‑token, sliced by model.
time_to_first_chunk
Tool usage & reliability
Which tools run, how often, how slow, how often they fail.
Adoption & impact
Edits accepted, lines shipped, edit survival, thumbs, PRs.
edit.survival · pull_request
Errors & sessions
Error types, stuck/aborted sessions, context compaction.
Why the cache missed
Truncation and compaction rewrite the prompt prefix — the direct cause of a miss. Span events tell you when.
session.compaction_start / _complete
One board. Flip the selector.
Cache calls and token volume, models, tools, and raw traces — filtered to VS Code, the CLI, or both. The August 2026 compatibility release adds the actual prompt-cache token hit rate, current/legacy AI-credit handling, corrected agent grouping, and exported truncation/compaction events.
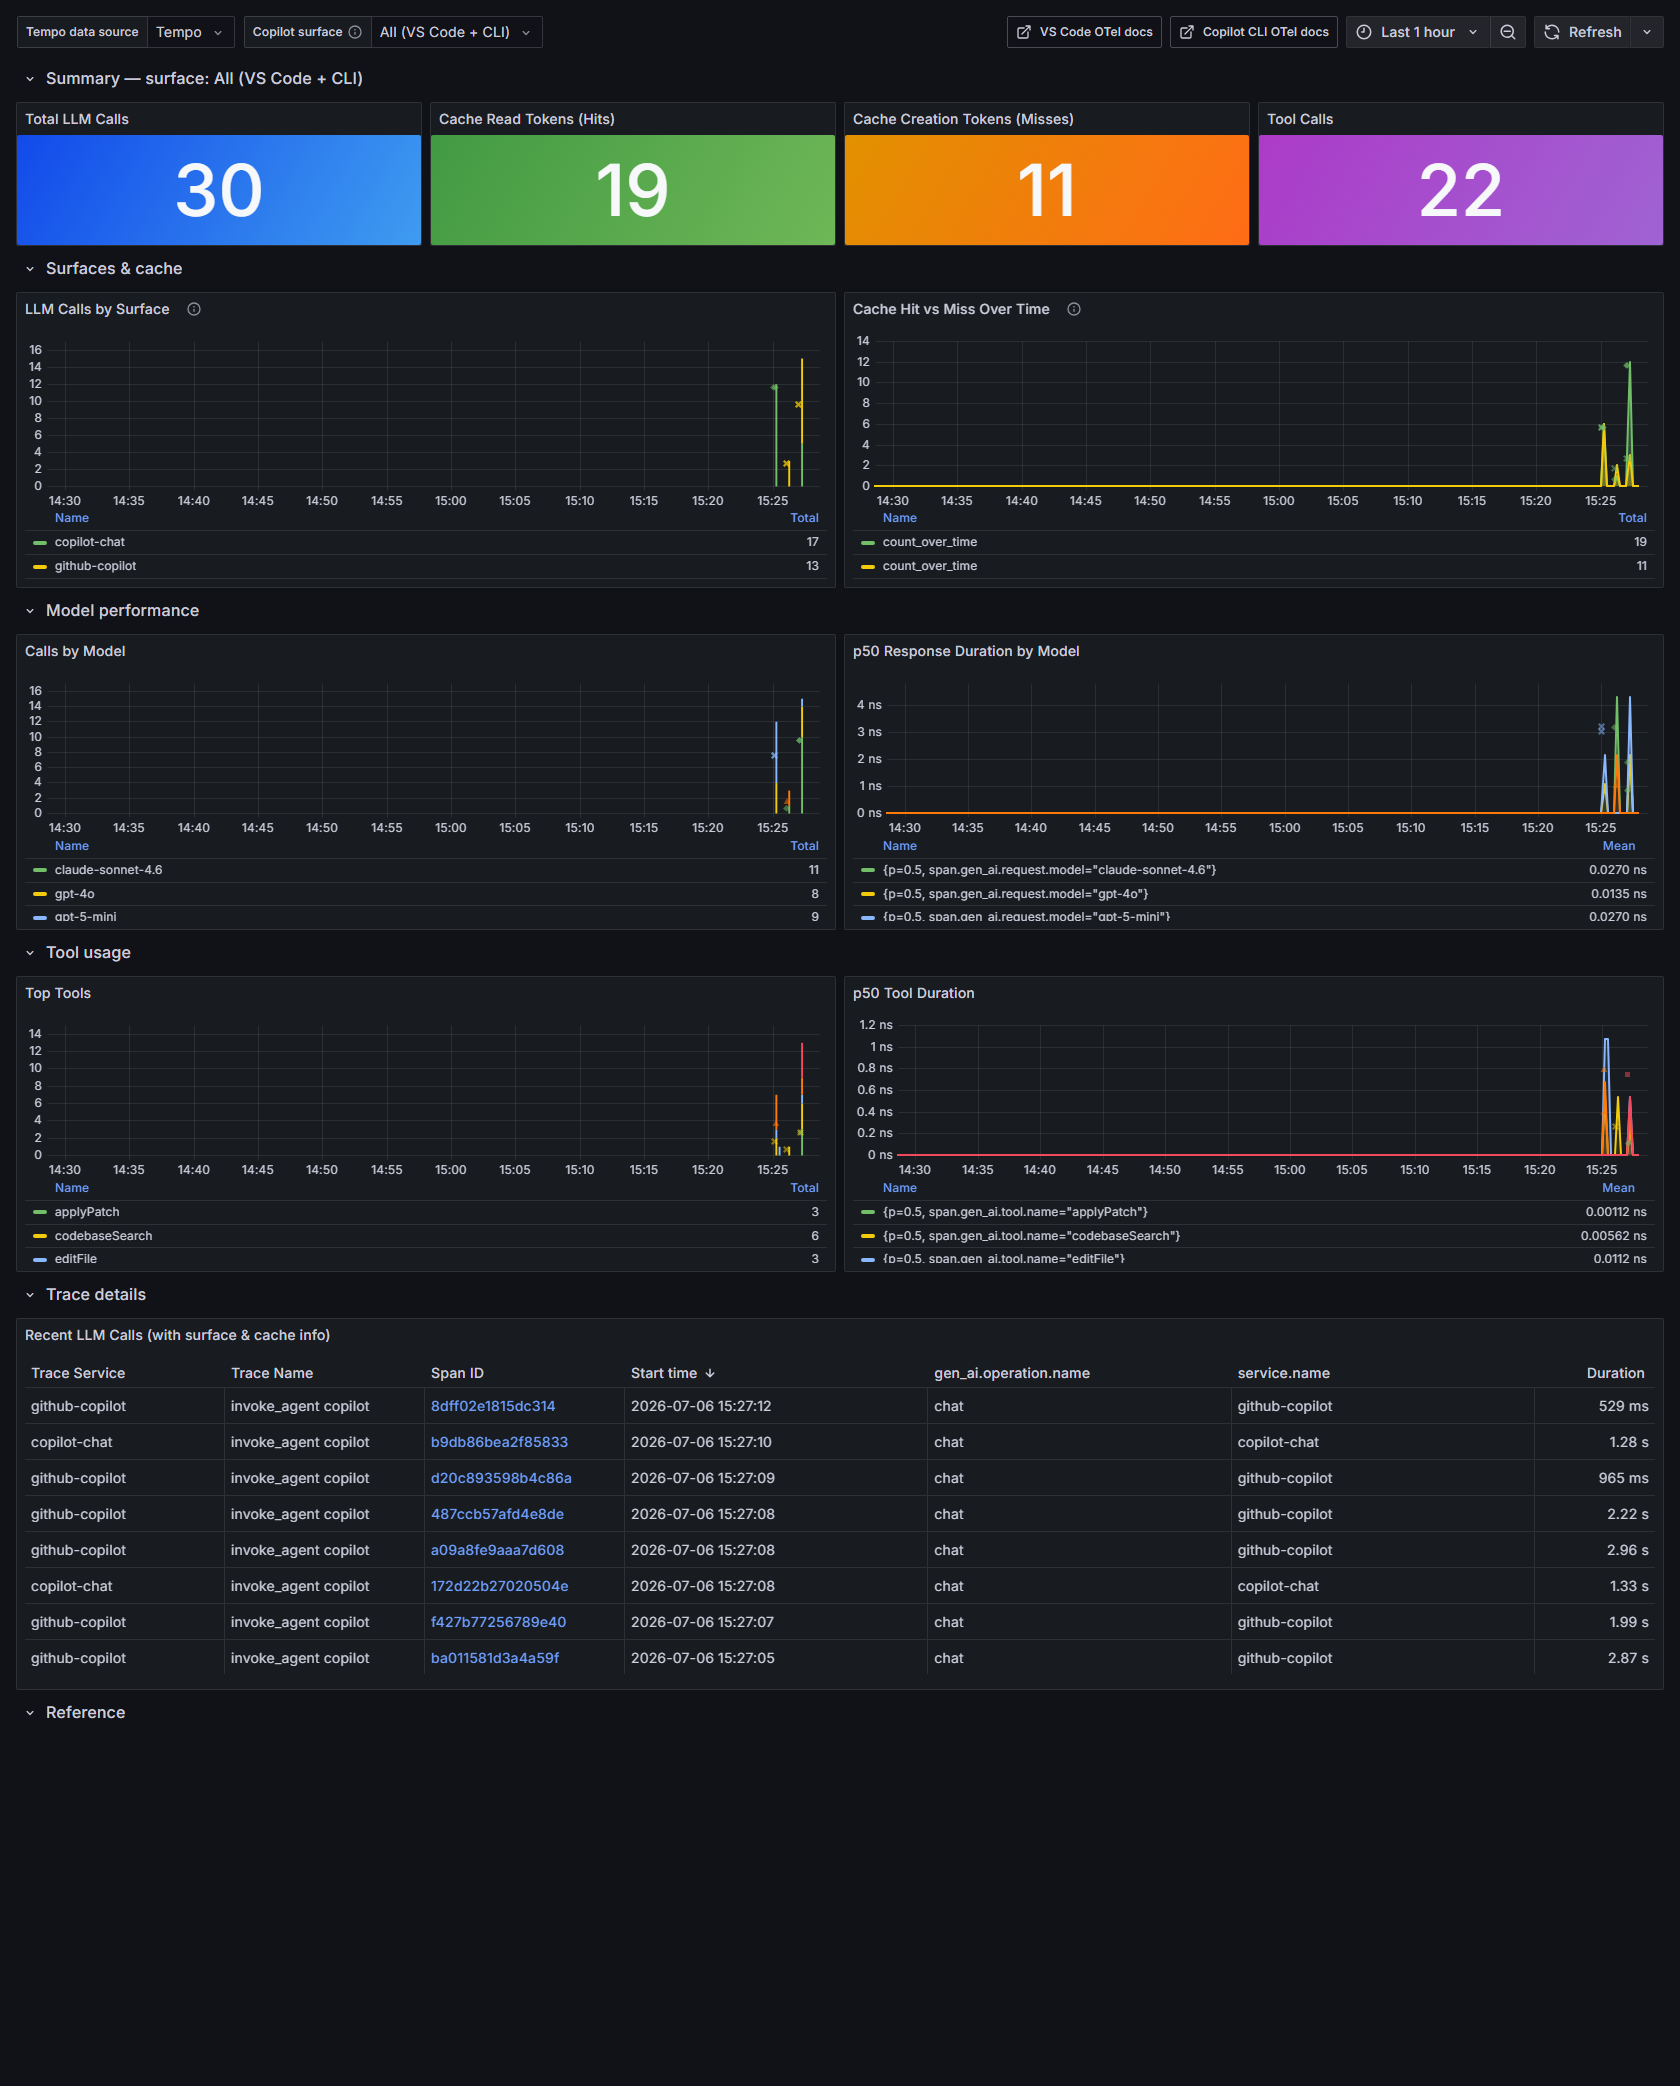
The All (VS Code + CLI) view, running on local Grafana + Tempo.
From a laptop to a fleet — four backends.
Same surfaces, same dashboard. Start local and offline; grow into your Azure tenant or Grafana Cloud. None of them needs a paid Grafana instance.
Local
Docker: Grafana Tempo + Grafana. Offline, private.
Azure · local collector
Collector fans out to Tempo and Application Insights.
Azure Container Apps
Cloud collector, scale‑to‑zero. Scrubs before App Insights storage.
Grafana Cloud
Point straight at managed Tempo. Nothing to run.
Private by default.
The question that decides whether you can roll this out — answered plainly.
Telemetry goes to the endpoint you configure. OTLP export does not create a second GitHub-controlled copy. The operator of your chosen backend still receives it — your team for local/Azure, or Grafana Labs for Grafana Cloud.
No prompts, code, or responses by default. Content capture is off — the GenAI conventions' deliberate opt‑in. You get metadata: model, token counts, durations, tool names, cache hits/misses.
"Content off" isn't "anonymous." Prompts, responses, system instructions, tool schemas/arguments/results are opt-in. Metadata still includes a CLI pseudonymous id when available, agent identity, invoked skill names/paths, tool metadata, and VS Code repo/branch/commit/org.
The collector is your minimization control point. Option B drops the pseudonymous id locally before cloud export. Option C strips span, content, repository, and skill-event attributes at the Azure collector before Application Insights stores them; the raw OTLP request has already left the device.
You choose where data lives. On your laptop, in your Azure region (pick an EEA region for residency), or Grafana Cloud's SaaS. Content capture, if you ever turn it on, only against a backend you own.
Clone, compose, chat.
The local path (Option A) needs no cloud account and costs nothing.
Bring up the stack
Grafana Tempo receives OTLP; Grafana serves the dashboard on port 3001.
# clone, then
docker compose up -dPoint Copilot at it
Four keys in your VS Code User settings — and the CLI reads the same via env vars.
{
  "github.copilot.chat.otel.enabled": true,
  "github.copilot.chat.otel.exporterType": "otlp-http",
  "github.copilot.chat.otel.otlpEndpoint": "http://localhost:4318",
  "github.copilot.chat.otel.captureContent": false
}Use Copilot, then watch
Ask Copilot Chat a few questions or run copilot, then open the board and flip the surface selector.
# open
http://localhost:3001  # → GitHub Copilot OTel — VS Code + CLI